
July Multifamily Market Update: Is Multifamily Turning the Corner?
Predictions are hard. That’s always been true, but it’s especially true since COVID in 2020. But I’m going to try anyway, so take this with the appropriate grain of salt.
It appears we’ve reached an inflection point in the U.S. apartment market. That doesn’t mean the market today is “strong” or even “balanced” yet. It means that after more than three years of backpedaling, we’re now moving in the right direction again. We’re still in a hole, but now we’re starting to dig our way out.
I suspect we’ll eventually look back at the first half of 2026 as an inflection point of this cycle, or the early stages of the new cycle. Here’s why:
1. Supply is plummeting in 2026.
We’ve all expected the supply drop-off for a long time, and it’s really happening. Following the historic supply wave of 2023-25, completions in the first half of 2026 totaled about 150,000 units (similar to pre-COVID norms), and it’s trending further down. There are still plenty of 2024-25 completions still competing to lease up and stabilize. In terms of new deliveries, they’re not evaporating entirely, but they are trending toward levels in the mid-2010s.
2. Apartment demand (absorption) was surprisingly strong in 1H 2026.
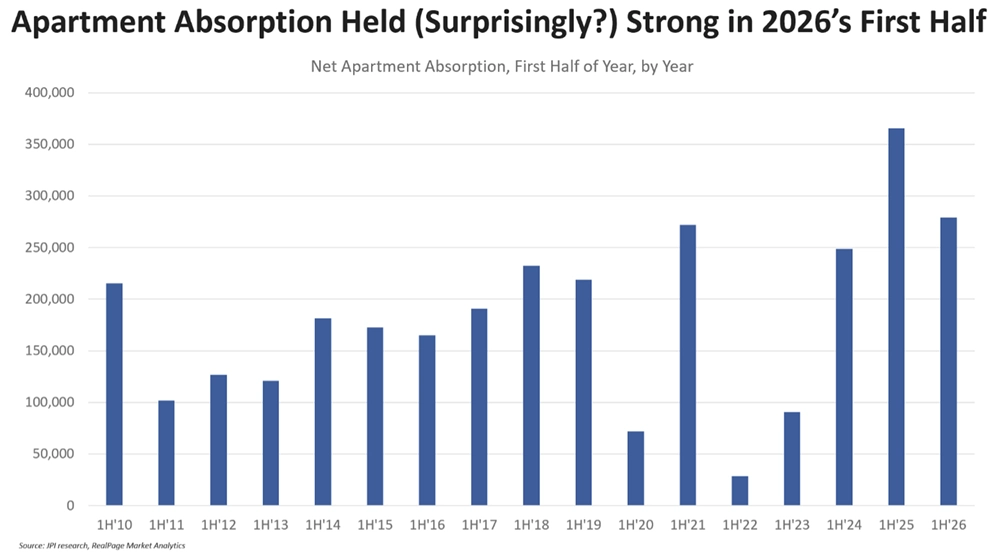
At the same time, apartment absorption has been surprisingly resilient. Despite all the headwinds (choppy job market, higher unemployment among recent college grads, re-accelerating inflation, low consumer confidence, etc.), we continue to see absorption levels way above normal. Both CoStar and RealPage reported 1H 2026 net absorption topping 250,000 units, which is down a bit from last year’s peaks but still higher than any year prior to COVID.
Skeptics will try to explain away those numbers, but the data is what the data is: We have more than a quarter-million NET NEW apartment renting households compared to what we had going into 2026. That is a positive no matter how you slice it. And those new households tend to pay 21% or 22% of income toward rent, so these new renters are (generally) in good shape financially.
Of course, we should acknowledge those demand-side headwinds remain very real. They may very well pull down absorption going forward (and I would certainly expect absorption numbers to moderate). So, no one is waving the “mission accomplished” flag here. We’re just saying the numbers to date have been very good—and probably better than anyone expected.
3. Vacancy is improving at the fastest pace since 2021.
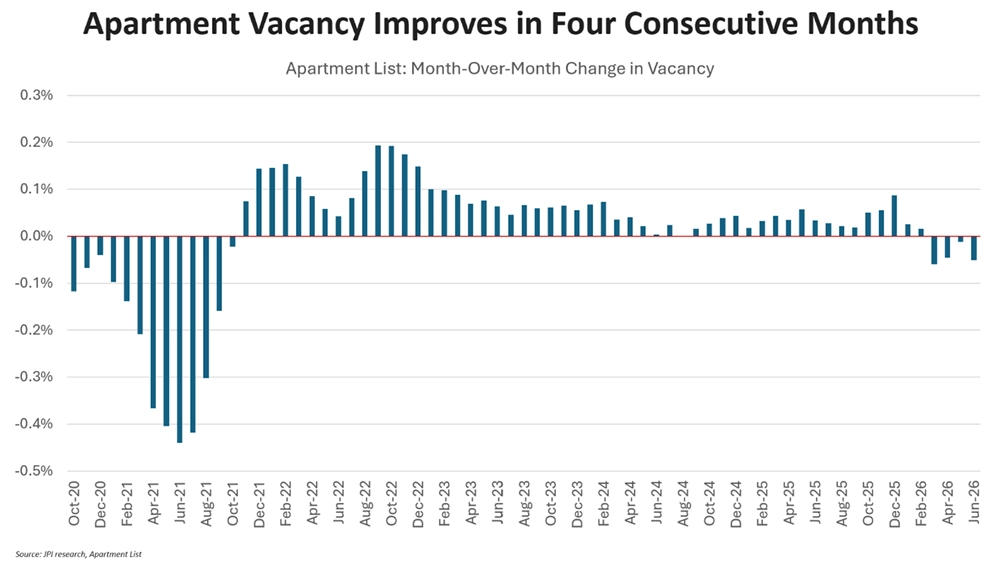
To be clear: Apartment vacancy rates remain elevated. There’s a big hole to dig out of following the largest supply wave since the 1970s. But we’re finally starting to see signs of real momentum.
Apartment List reported vacancy improvement in each of the past four months. That’s the first time that’s happened since 2021.
CoStar reported the largest Q2 vacancy decline since 2021.
And RealPage reported year-to-date vacancy declines topping any year since—you guessed it—2021.
Again, there’s still a long way to go. But reduced deliveries + resilient demand = improving occupancy. There’s little chance for renewed pricing power until vacancy rates rebound, so this is just one step in the process.
4. Rents remain soft but are starting to show some momentum.
Back in January, I wrote that apartment rents may have bottomed. So far, that hot take appears to be holding up.
Indeed, rents showed real momentum in Q2. Yes, year-over-year effective rent change is still negative in most higher-supplied markets, and yes, new lease rent trade-out is often negative, too.
But we’re talking about momentum here. Nationally, quarter-over-quarter rent change in Q2 came in at a four-year high, according to both CoStar and RealPage. On new lease trade-out (which is closer to a year-over-year metric), rents are less negative than previously. In fact, CoStar is showing effective quarter-over-quarter rent growth of 1.2%, which is closer to 2017-19 levels than to 2023-25 levels.
Here’s another little factoid: Even if there’s flat rent movement in the second half of 2026, we could end the year with around 2% rent growth. That’s because the second half of 2025 was the worst second half for rents in more than 15 years. So, as long as we don’t repeat that, we should see incremental improvement in the headline year-over-year rent metric.
5. Even heavy-supplied markets are showing momentum.
Again, we’re talking momentum here. In many higher-supplied markets, rents are still falling year-over-year, but at a moderating pace. In fact, here’s a trivia shocker for you: Guess which market saw the most momentum in YoY rent change between March and June?
It’s Austin, Texas: The market that is Exhibit A for what happens when we build a ton of apartments. The answer: Rents fall. Deliveries are now tapering back fast. And while there are still plenty of 2024-25 completions working through prolonged lease-ups and keeping pressure on vacancy rates, there are undoubtedly signs of momentum.
In this case, when I say “momentum,” I am looking at the second derivative in YoY rent change. What was rent change in June 2026, and how does that compare to March 2026? How much did that YoY number swing over the past three months?
No market saw a bigger upward swing than Austin. (In fairness, few markets had as much room to swing as Austin, either.) In March, rents were down 7.5% YoY in Austin. In June, rents were down 3.9% YoY. That’s a swing of 360 bps, and that’s the best in the country.
Right behind Austin is the already-hot trio of San Francisco Bay Area markets. Then the other markets rounding out the Top 10 are mostly higher-supplied markets in the Sun Belt and Mountains: Salt Lake City, Denver, Jacksonville, Riverside, Tampa, and Raleigh. In most of those cases, as with Austin, rents are still down year-over-year, but to a lesser degree than previously.
So, for all my friends in Austin and other high-supply markets: Don’t get too excited yet. There’s obviously still plenty of work to do. But we’re finally seeing some positive signs that momentum is shifting. You might even call it an inflection point.