
September Multifamily Market Update: It’s the Most ‘As Expected’ Year Since 2019
As we near the final quarter of 2026, and at the risk of jumping the gun ahead of the finish line, I think we can say it: It feels like the most “as expected” year since 2019 for apartments (although certainly not for single-family rentals and build-to-rent properties).
Why do I say that? A few reasons:
- Going into this year, most prognosticators predicted 1% to 2% effective rent growth as the supply wave petered out. And, sure enough, we’re on track to finish the year just shy of 2%.
- We expected to see vacancy rates start to improve as completions thinned out. That’s happening in most markets.
- Everyone knew there’d be less supply completing and continued challenges getting new projects started. That’s held true (though starts haven’t totally evaporated like they did in the early 2010s).
- On the capital side, the story from NMHC’s Annual Meeting (multifamily’s biggest shindig) earlier this year was that equity was hard to find but debt abundantly available. That’s played out. Debt originations are sky high, but mostly for refinancings, while sales volumes are crawling up at a snail’s pace.
- We’ve seen the return of more normal-ish seasonality with both leasing and rents.
If there’s any real “surprise,” it’s that apartment absorption remains quite strong (and better than most forecasters expected) despite jitteriness in the job market.
So, “it’ll fix in ’26” hasn’t quite borne out, particularly due to the stickiness of high interest rates preventing a rebound in valuations. But it’s certainly a big step in the right direction.
Here’s a breakdown going into a bit more depth, starting with the occupancy and rent recovery.
Occupancy Inching Back Upward
After three-plus years of more supply than demand leading to occupancy backpedaling, we’re now moving forward again—albeit gradually. Apartment List shows occupancy improving 20 bps since March, the best streak since 2021, while RealPage shows growth of 50 bps over the same timeframe.
The focus on “heads on beds” and protecting occupancy appears to be (for the most part) paying off, particularly at the upper end of the market.
Yes, it’s a concession-rich environment to get there. But I see concessions, like rent cuts, as a way to grab more than your fair share of the existing demand pie.
As Yardi wrote in its latest report, “the sector appears to be moving in the right direction.”
YTD Rent Growth Is Best in 4 Years
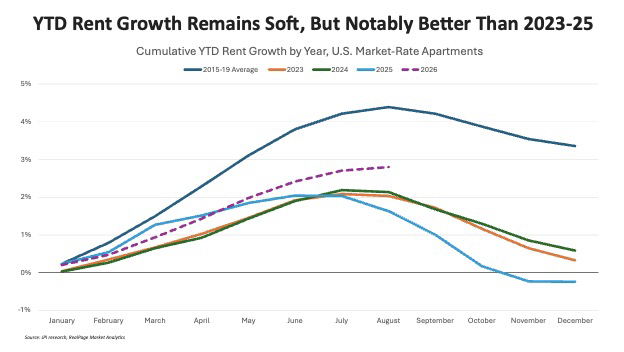
Most major data providers are showing modest re-acceleration in rent growth. Realpage data shows year-to-date rent growth of 2.8% through August. That’s better than 2023-25, though still below pre-pandemic norms above 4%. Bear in mind: Rents are seasonal, and backtracking through the latter four months of the year is normal. Thus, we’re on track to end the year around 2%.
Realpage recently wrote that August data “reinforced signs of continued pricing recovery,” while CoStar wrote that the latest trends suggest “some improvement in pricing conditions.”
What’s especially notable is the widespread improvement in rent momentum across the country. It appears that rents bottomed in March, and the rent growth rate (even de-seasonalized) has improved ever since. I shared a chart on LinkedIn this week that shows rent growth and rent momentum. Nearly every major U.S. market sees higher year-over-year effective rent growth today than it was back in March.
That includes a mix of coastal markets—not only the booming Bay Area—but also the recent laggards like Boston and D.C.
It also includes the Sun Belt, which now sees material momentum as it recovers from the supply wave. Austin, for example, leads the country with a 648 bps swing in YoY rent growth between March and August. Of course, rent change is still negative (-1%), but it’s the smallest cut in more than three years and an encouraging sign that the market (and others like it) could soon turn positive. We’re seeing similar trends to lesser degrees in places like Salt Lake City, Phoenix, Tampa, Denver, Raleigh, Dallas, and South Florida.
As I noted last month, we’ve already seen a few smaller supply-drenched markets rejoin the national rent growth leaderboard, and I would expect others to join them in coming months.
Notably, even as occupancy and effective rents improve, concessions remain sticky … and that may remain the case for a while.
Capital Markets: Volumes and Cap Rates Tick Up Slightly
Sticky high interest rates continue to frustrate would-be sellers and buyers alike. Multifamily cap rates have inched up a hair from 5.5% in Q4 2025 to 5.7% as of July 2026, according to MSCI Real Capital Analytics, though on limited volumes.
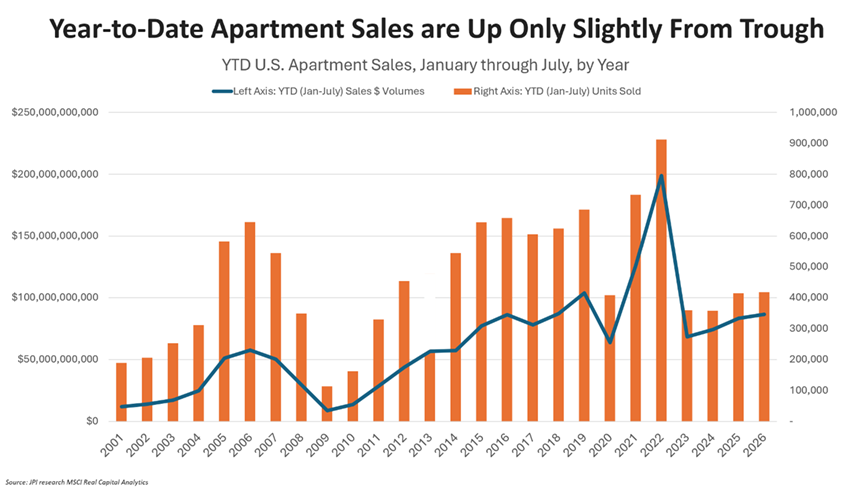
Year-to-date through July, sales volumes totaled $86.5 billion. That’s up 4.1% from the same time last year, and it’s up 26.6% from the low point of 2023… and yet still down 56.5% from the peaks of 2022.
Maybe the most telling stat is to compare sales volumes, by dollars and by units, to the pre-COVID peak of 2019. Year-to-date through July, we’re down 17% on dollar volumes but down a more dramatic 39% by unit volume, according to MSCI.
As noted earlier, it’s a different story on the debt front. Newmark research shows 2026 on track to be the second-biggest year on record for multifamily loan originations, with $191 billion originated through the first half of the year. The only time originations were higher during the same period was in 2022. But, of course, most of that debt is going toward refinancings, not sales transactions.
And the availability of debt capital may be both a) stabilizing values and b) limiting sales volumes.