Senior Housing & Long-Term Care’s Demand Wave Over The Next Decade
How demographics, operations, and capital will redefine senior care—and what operators can do now.
How demographics, operations, and capital will redefine senior care—and what operators can do now.
According to the trade association, Argentum, the aging curve will drive demand, but demand won’t show up as a simple need for more units. It will show up as a need for operating capacity—staffing, coordination, safety, and decision-making—delivered inside a residential experience that still feels like home. As residents wait longer to move, communities will see higher acuity at entry, faster care-plan changes, and shorter average stays. Those shifts will hit unit economics through labor intensity, turnover costs, incident risk, and the speed and discipline of unit turns.
Family caregiving will also matter. Families still carry much of the day-to-day support that keeps older adults safely at home, according to the National Investment Center for Seniors Housing & Care (NIC). When that support breaks down because adult children live farther away, caregivers work full-time, or burnout sets in, senior housing absorbs more than demand. It absorbs responsibility.
“But to the extent we have any type of senior housing system today, the bedrock of the system is family care,” says Robert Kramer, Co-founder and Strategic Advisor at NIC.
At the same time, supply constraints in the senior housing sector will create opportunity and pressure. Many markets will benefit from limited new inventory, but tighter supply won’t automatically translate into stronger NOI. Labor, insurance, compliance, and higher acuity can erase occupancy gains if operators don’t tighten systems.
For years, many investors treated senior housing as “alternative” real estate. The sector didn’t always fit neatly into standard real estate benchmarking, and investors struggled to compare it to other property types with consistent data.
But that’s changing. In 2024, senior housing became a standalone sector within the NCREIF Property Index (NPI), a widely used institutional benchmark, improving “performance transparency” and elevating senior housing alongside major core property sectors.
“Broadly speaking, as a property type, senior housing has never been hotter in the last 40 years,” Kramer says. “And then on top of that, you have greater transparency into the performance of the sector than you’ve ever had before.”
The practical implication is straightforward. When investors and lenders can compare senior housing performance more easily using clearer, standardized benchmarks, they stop relying on broad narratives like “the age wave is coming.” Instead, they push operators to prove the story with specifics.
Operators who can explain resident mix, labor strategy, compliance posture, and lease-up risk with clean supporting data will earn better outcomes than operators who rely on the macro demand narrative alone.
“Better benchmarks raise the bar,” says Lauren Tisdale, Managing Director of Healthcare Lending at X-Caliber. “Capital partners still back the demand story, but they want to see a clean bridge from operations to cash flow.”
Demand will grow, but it won’t show up as a single, predictable wave across every market or product type. Operators will feel it through who moves in, why they move, and what level of support they need on day one.
The demographic setup matters. NIC MAP Vision projects the 80+ population to rise sharply through 2035. But more seniors doesn’t mean identical demand for independent living, assisted living, memory care, and skilled nursing in every market. Operators still win or lose locally based on income distribution, household composition, caregiver availability, and competitive inventory.
This is where operators can improve their planning model: stop treating demand as age-only. Anchor your demand view in three lenses that map to operating decisions:
Across multiple subtypes, operators see residents delay the move until need increases. That pushes higher acuity at entry and compresses length of stay. As a result, Kramer notes, people are moving into senior housing for the last 18 months of their lives, “rather than even the last three years.”
That shift hits every line item that matters:

Kramer flagged a structural stressor that baby boomers aren’t feeling—but Millennials and Gen Z will: the rise of the “solo ager.” Solo agers are those who age into care settings without a strong family or other support network.
As more households age with fewer caregivers available, operators will face higher expectations around coordination, communication, and friction reduction. This shows up in day-to-day operations: transportation support, appointment logistics, care partner coordination, and “trusted advisor” roles in the absence of adult children.
“With fewer children [being born]—who are more likely to be childless as adults—the increase in solo agers could go from 4% to 30% of the older adult population,” Kramer says. “That has enormous ramifications. There’s no one senior housing solution for this. We need as many different solutions as possible, and we need to remove the barriers to each of those solutions that enable them to scale.”
NIC MAP Vision’s 2030 shortfall estimate highlights the core imbalance: demand growth outpaces the current supply trajectory. Occupancy data reinforces the point: NIC reported independent living occupancy reaching 90.2% in the third quarter of 2025 (first time above 90% since 2019) and assisted living at 87.2%.
Supply stays constrained for familiar reasons: land, entitlement, construction timelines, and feasibility. In practical terms, this dynamic pushes two outcomes simultaneously:
“Demand exceeds supply, and that’s not going to change—at least between now and the end of the decade, given that there’s very little new construction going on now and the average property is taking 30 months to get open,” Kramer says.
This is the window many operators and capital partners chase right now: existing communities that can absorb demand faster than any new construction timeline. Replacement costs stay high, construction schedules stay long, and feasibility stays tight in many markets. So, teams increasingly compete for “fix-and-improve” opportunities—assets where targeted capex, an operating reset, and a clearer positioning strategy can create faster lease-up traction than new construction can deliver.
That dynamic also explains why “non-new-build” strategies matter more than ever: repositioning older product, expanding in proven submarkets, and deploying capex that improves competitiveness without taking full ground-up risk. Kramer estimates that about half of the nation’s senior housing stock is at least 25 years old, creating a deep pipeline of assets that can earn a second life with the right scope and operating plan.
Occupancy trends and demographic tailwinds create opportunity, but they don’t solve the operating equation. Senior housing performance still hinges on execution—especially labor stability, resident fit at move-in, and the discipline of running a higher-acuity model inside a residential experience.
Rising occupancy creates room to breathe, but labor, insurance, and care delivery complexity determine whether that room translates into durable NOI.
A useful way to think about today’s senior housing model is that most operators run two businesses at once: (1) a hospitality business that sells experience, lifestyle, and community, and (2) a care business that manages risk, outcomes, documentation, and staffing intensity.
When residents enter later with higher needs, the “care business” starts earlier in the stay. That makes process discipline more valuable than incremental marketing spend.
Kramer notes the pace of change and why it strains operators, which may be most apparent in relation to technology: “The greatest challenge right now in the senior living sector is that the pace of change is so rapid. Most operators don’t have the bandwidth to vet the technology, and they don’t have the expertise to figure out what works and what doesn’t for the problems they’re trying to address.”
That wisdom also applies beyond technology. The winners will build repeatable routines so they can adapt faster without rebuilding the business each time costs shift.
Affordability will shape demand—but operators can’t solve it with pricing alone. Operators control affordability through product decisions that change the cost structure and protect service quality: unit mix, finish levels, amenity spend, operating model, and how services show up in rent.
For affordable senior housing—age-restricted communities that can align with HUD financing under MAP—the playbook centers on disciplined scope and durable operations:
This is where “missing middle” strategy gets practical: operators win when they align resident budgets, operating reality, and a financeable structure without overbuilding the amenity package or the service promise.
This matters for operators deciding where to grow. In many markets, the strongest long-run strategy may be a portfolio mix that serves different income brackets and resident need profiles, rather than a single product bet.

Senior housing will remain heavily private-pay in many subtypes, but payor strategy increasingly influences feasibility for higher-acuity models and for operators who want to reduce avoidable events through stronger coordination.
Medicare Advantage’s mix continues to evolve. Healthcare news site KFF reported that in 2025, one in five (21%) Medicare Advantage enrollees was in a Special Needs Plan (SNP). Those plans often emphasize coordination for high-need populations, which can create partnership pathways for operators who can document outcomes and manage transitions well.
This is not a universal prescription. Partnerships add complexity and require operational readiness. But they will increasingly differentiate operators who can translate care coordination into measurable results.
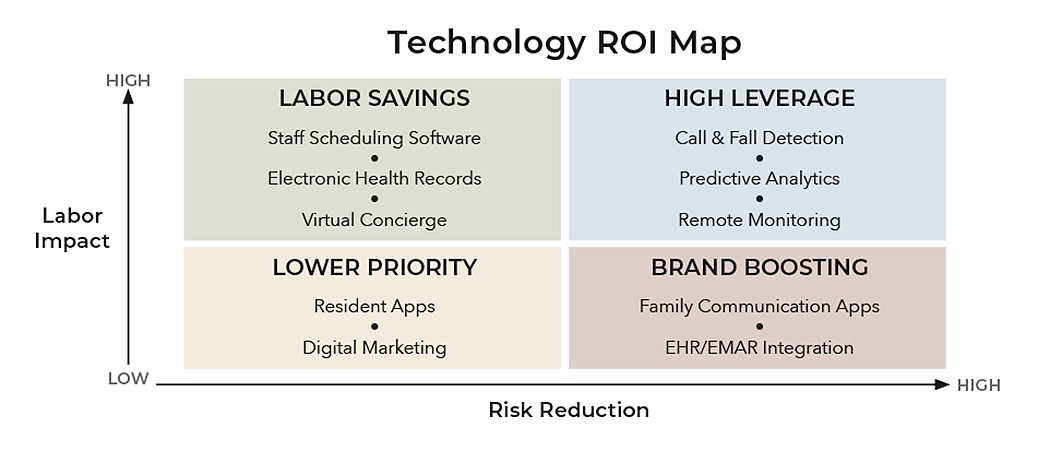
Senior housing technology investment often is held back when it aims for “innovation” rather than measurable performance. The adoption that sticks tends to attach to two outcomes: labor efficiency and incident reduction.
Kramer says AI in senior housing has centered on two areas: staffing and fall prevention. A disciplined filter helps operators avoid tool fatigue:
“Now, with senior housing, long-term care, and the healthcare system, you’ve got to have an integrated platform,” Kramer says. “You’ve got to be able to share information, and you’ve got to be able to share it in as close to real time as possible.”
As benchmarking improves, more capital will consider senior housing. But the underwriting will continue to focus on realities operators manage every day: staffing, lease-up, and—where applicable—reimbursement exposure.
“Senior housing underwriting doesn’t stop at the building,” Tisdale says. “Lenders and equity partners underwrite the operator—systems, staffing depth, and the ability to manage acuity-driven expenses without losing service quality.”
Agency underwriting illustrates how lenders translate operating intensity into requirements. Fannie Mae lists minimum DSCRs that step up by subtype: 1.30x for 100% independent living, 1.40x for 100% assisted living, and 1.45x for stand-alone memory care.
One way to visualize this is to map the capital stack to “risk owners”—the risks each source screens first and prices most aggressively. That framing helps operators match financing to the real pressure points in the business.
“Each capital source screens a different risk first. The strongest financings line up the capital stack with the project’s real pressure points, like lease-up, labor execution, compliance requirements, or reimbursement exposure,” Tisdale says.
For healthcare-oriented assets, the Department of Housing and Urban Development (HUD) has also made process moves intended to reduce friction for qualifying transactions. HUD announced an Express Lane review track to expedite FHA-insured refinancing applications under Section 232/223(f) for eligible, low-risk transactions, with stated goals of issuing a Firm Commitment in 10–15 days under the new process.
For operators, the key is not the headline timeline—it’s readiness and eligibility. Express Lane-style programs reward complete, program-aligned submissions and stable operating profiles.
“HUD-insured executions can fit well for operators who want long-term, program-driven terms, but success hinges on eligibility and file readiness. Teams that align early around third-party reports and compliance items reduce avoidable friction,” Tisdale says.
X-Caliber’s senior housing and healthcare overview summarizes HUD Express Lane mechanics and where it tends to fit within a broader healthcare finance toolkit.
Regulation and reimbursement will continue to vary by state and by care level. Operators should expect policy to shift unevenly and plan accordingly through compliance systems, staffing strategy, and capital reserves.
“Regulatory variability shows up in budgets first. Operators and capital partners that plan for compliance-driven costs avoid reactive decisions later,” Tisdale says.
Recent nursing home staffing policy changes illustrate how quickly the landscape can turn. In December 2025, the Department of Health and Human Services formally repealed provisions of the federal nursing home staffing mandate, which had created the first national minimum staffing requirements.
The evergreen lesson is not the specific rule. The lesson is that staffing expectations, formal or informal, can change faster than most business plans. Operators who build resilient staffing and training systems will outperform operators who treat compliance as episodic.
There isn’t one universal operating model, but there is a consistent set of drivers: later move-ins, higher acuity at entry, labor pressure, affordability gaps, and constrained supply.
Here are four operator pathways that tie those drivers to concrete decisions without locking the strategy to a single year.

Because demographic projections anchor to 2035, it is useful to explore scenarios through that horizon. The goal is not prediction; it is preparedness.
Base case: Demand realizes projections, supply remains constrained in many markets, and performance concentrates among operators with disciplined labor, pricing, and care delivery systems.
Upside case: New product formats (including middle-market variants) scale in more markets, partnerships expand for operators who can document outcomes, and technology adoption improves labor productivity and incident reduction.
Downside case: Affordability gaps widen further, staffing pressure persists, regulatory variability increases, and more care shifts into aging-in-place models and informal caregiving—until caregiver capacity becomes the binding constraint.
Across all three, the direction stays consistent: demand rises, and execution separates operators more than the macro narrative does.
Senior housing’s macro story will stay visible for years: the 80+ cohort grows sharply, and supply lags the pace required to meet demand.
The operators who convert that story into durable performance will keep returning to a small set of decisions:
Kramer’s reminder about the long-term care “system” is worth keeping on the desk as those decisions get made: “But to the extent we have any type of system, the bedrock of the system is family care.”
As that bedrock weakens for many households, senior housing operators who reduce friction and deliver consistent service will carry a larger share of the solution—because the market will ask them to.
___________________________________________________________________________________
Lauren Tisdale is a Managing Director, Healthcare Lending at X-Caliber, where she originates seniors housing and healthcare transactions nationwide across the firm’s lending platforms. She has more than 20 years of experience in real estate finance and banking, with leadership experience spanning origination, legal, compliance, and enterprise risk management.
Robert Kramer is the co-founder and former CEO of the National Investment Center for Seniors Housing & Care (NIC) and now serves as a Strategic Advisor, helping shape the sector’s research, data, and capital markets dialogue. He is also the founder of Nexus Insights, with 35+ years of senior housing and aging-service leadership experience.
National Investment Center for Seniors Housing & Care. (2026, January). Occupancy Rate for Senior Living Communities Increased in 2025 as Construction Stalled
nic.org/news-press/occupancy-rate-for-senior-living-communities-increased-in-2025-as-construction-stalled/
Brookings Institute. (2026, January). Baby boomers are turning 80.
brookings.edu/articles/baby-boomers-are-turning-80/
National Investment Center for Seniors Housing & Care. (2026, January). Healthcare drivers and outlook for senior housing and care in 2026.
nic.org/blog/healthcare-drivers-and-outlook-for-senior-housing-and-care-in-2026/
CBRE. (2025, December). U.S. senior housing and care investor survey H2 2025.
cbre.com/insights/reports/us-senior-housing-and-care-investor-survey-h2-2025
AHCA/NCAL. (2025, September). 2025–2026 nursing home report reveals lower turnover.
ahcancal.org/News-and-Communications/Blog/Pages/2025%E2%80%932026-Nursing-Home-Report-Reveals-Lower-Turnover.aspx
LeadingAge. (2025, August). Nursing home turnover rates decline in 2025.
leadingage.org/nursing-home-turnover-declines-2025/
Argentum. (2025, January). Senior living in 2025: navigating challenges and seizing opportunities.
argentum.org/senior-living-in-2025-navigating-challenges-and-seizing-opportunities/
Congressional Budget Office. (2025, January). The demographic outlook: 2025 to 2055.
www.cbo.gov/publication/61164
NIC MAP. (2025). Senior housing: five key trends to watch in 2026.
nicmap.com/blog/senior-housing-five-key-trends-to-watch-in-2026/
NIC MAP. (2025). The impending age wave.
nicmap.com/blog/the-impending-age-wave-navigating-the-urgent-need-for-senior-housing/
Population Reference Bureau. (2024, January). Fact sheet: aging in the United States.
prb.org/resources/fact-sheet-aging-in-the-united-states/
Census.gov. (2020, February). Demographic turning points for the United States: population projections for 2020 to 2060.
census.gov/content/dam/Census/library/publications/2020/demo/p25-1144.pdf